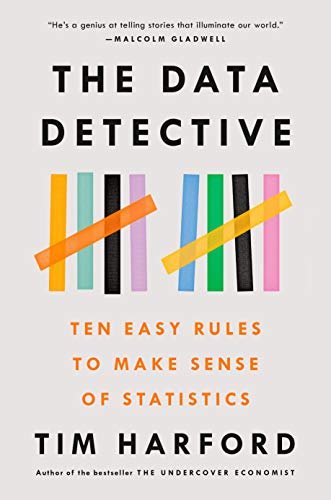
The Data Detective: Ten Easy Rules to Make Sense of Statistics
This is another great book, it is the 4th in a series that I seem to be on at the moment. Exploring all the ways we think that we are right, that we have the answer, that our perspective is true... only to be wrong. This one was recommended from a few VC’s on twitter and I wanted to see what all the buzz was about.
Today we think statistics are the enemy, numbers used to mislead and confuse us. That’s a mistake, Tim Harford says in The Data Detective. We shouldn’t be suspicious of statistics—we need to understand what they mean and how they can improve our lives: they are, at heart, human behavior seen through the prism of numbers and are often “the only way of grasping much of what is going on around us.” If we can toss aside our fears and learn to approach them clearly—understanding how our own preconceptions lead us astray—statistics can point to ways we can live better and work smarter.
Some of my Kindle notes include
Storks Deliver Babies (p = 0.008).
💡 We often find ways to dismiss evidence that we don’t like. And the opposite is true, too: when evidence seems to support our preconceptions, we are less likely to look too closely for flaws.
The counterintuitive result is that presenting people with a detailed and balanced account of both sides of the argument may actually push people away from the center rather than pull them in. If we already have strong opinions, then we’ll seize upon welcome evidence, but we’ll find opposing data or arguments irritating. This biased assimilation of new evidence means that the more we know, the more partisan we’re able to be on a fraught issue.
For an extreme illustration, imagine a hypothetical train line with ten trains a day. One rush-hour train has a thousand people crammed onto it. All the other trains carry no passengers at all. What’s the average occupancy of these trains? A hundred people—not far off the true figure on the London Underground. But what is the experience of the typical passenger in this scenario? Every single person rode on a crowded train.
Economists tend to cite their colleague Charles Goodhart, who wrote in 1975: “Any observed statistical regularity will tend to collapse once pressure is placed upon it for control purposes.” (Or, more pithily: “When a measure becomes a target, it ceases to be a good measure.”)
While Benjamin Scheibehenne had been digging into one particular field—the link between motivation and choice—Nosek’s network wanted to cast their net widely. They chose a hundred studies. How many did their replication attempts back up? Shockingly few: only thirty-nine. Scientists sometimes call this practice “HARKing”—HARK is an acronym for Hypothesizing After Results Known.
💡 The power to not collect data is one of the most important and little-understood sources of power that governments have . . . By refusing to amass knowledge in the first place, decision-makers exert power over the rest of us. • Anna Powell-Smith, MissingNumbers.org
💡 Psychologists are increasingly acknowledging the problem of experiments that study only “WEIRD” subjects—that is, Western, Educated, and from Industrialized Rich Democracies.
But N = All is often more of a comforting assumption than a fact. As we’ve seen, administrative data will often include information about whoever in the household fills in the forms and pays the bills; the admin-shy will be harder to pin down. And it is all too easy to forget that N = All is not the same as N = Everyone who has signed up for a particular service. Netflix, for example, has copious data about every single Netflix customer, but far less data about people who are not Netflix customers—and it would be perilous for Netflix to generalize from one group to the other.
💡 Shane in her book You Look Like a Thing and I Love You: an algorithm that was shown pictures of healthy skin and of skin cancer. The algorithm figured out the pattern: if there was a ruler in the photograph, it was cancer. If we don’t know why the algorithm is doing what it’s doing, we’re trusting our lives to a ruler detector.
💡 beliefs are hypotheses to be tested, not treasures to be guarded,” wrote Philip Tetlock
First, we should learn to stop and notice our emotional reaction to a claim, rather than accepting or rejecting it because of how it makes us feel.
Second, we should look for ways to combine the “bird’s eye” statistical perspective with the “worm’s eye” view from personal experience.
Third, we should look at the labels on the data we’re being given, and ask if we understand what’s really being described.
Fourth, we should look for comparisons and context, putting any claim into perspective.
Fifth, we should look behind the statistics at where they came from—and what other data might have vanished into obscurity.
Sixth, we should ask who is missing from the data we’re being shown, and whether our conclusions might differ if they were included.
Seventh, we should ask tough questions about algorithms and the big datasets that drive them, recognizing that without intelligent openness they cannot be trusted.
Eighth, we should pay more attention to the bedrock of official statistics—and the sometimes heroic statisticians who protect it.
Ninth, we should look under the surface of any beautiful graph or chart.
Tenth, we should keep an open mind, asking how we might be mistaken, and whether the facts have changed.
Here is the LINK to the AMAZON Book


